Big data plus real-world context equals community health improvements

Carly Levitz, GHRI research associate and data geek, tells her secret for getting the full story of a community health program.
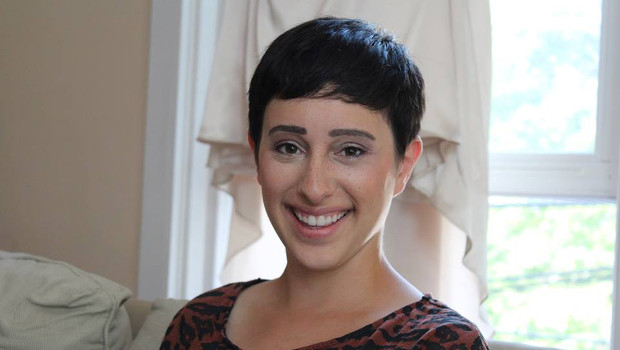
by Carly Levitz, research associate, Center for Community Health and Evaluation.
Right now, it’s hip to be a data geek. Big data is all the rage, and if you have quantitative analysis skills, you’re in high demand. I’m a data geek. I am a curious, data-hungry story weaver with a passion for public health.
I think of the world with the mind of a sociologist: I see the world as groups of people and their interaction with institutions. It’s my penchant for statistics, though, that got me my current job. In the marriage of medical sociology and statistics (my college major and minor, respectively), I have found a way to improve the health of populations: letting the data tell their own story. Not just the quantitative data; all data. I work at the Center for Community Health and Evaluation at Group Health Research Institute, where we pride ourselves in our mixed-methods approach to assessing community health projects. This means we use all the data and analytical methods possible to inform people who fund and implement community health programs about what leads to success and which barriers are most prohibitive.
Our mixed-methods approach of collecting qualitative data (like interviews of clinic leaders) and quantitative data (like percentage of patients with controlled blood pressure) addresses a duality in public health research: the desire to know a community’s story and the yearning for “cold, hard facts.” While we can never fully know the story of a community, through qualitative data we can begin to understand how its environment influences its leaders’ choices as well as what choices are available. Quantitative data and statistics can tell us if and how measures are changing over time.
To fully understand your numbers, put them in context
My team’s site visits to rural health centers in Sacramento, CA (for one of these projects) taught me more than numbers of health centers’ progress or lack thereof. I saw first-hand how health centers are run; how having the right people on a team can make all the difference to making change “stick”; how each data point has a story behind it.
On that same project, I got my hands dirty with quantitative data. I didn’t take them at face value; they were the starting point for conversations. With analysts and implementers on the ground, these conversations provided me invaluable context for the data and made me a stronger evaluator: The people whose work was represented in the data told me why I was seeing the trends that I had documented. They told me how they had made those changes happen, and what happened to cause an outlier in a specific month.
Yes, measurable quantitative impact is paramount for us data geeks. But if you also work with big data: Have you overlooked asking someone what they think made a health program or initiative successful? The intersection of statistics, sociology, and public health is where you can begin to truly measure the impact an initiative has on health. The measurement of quantitative data and the rigorous collection of stories can, together, give you a fuller picture from which you can inform program improvement and future program funding decisions.
So when are you going to ask your collaborator, funder, or study participant: What does this program mean to you?
Carly Levitz earned her MPH from the University of Washington in Health Metrics and Evaluation. She earned her BA in Sociology of Medicine and a minor in Statistics from the University of Pennsylvania.